Measuring & interpreting

Measuring & interpreting
Measuring & interpreting
Part I explains what lactate is; Part II teaches you to measure and read it — from thresholds and curve interpretation to protocols, sampling and the right retest moment.
Thresholds and transition zones
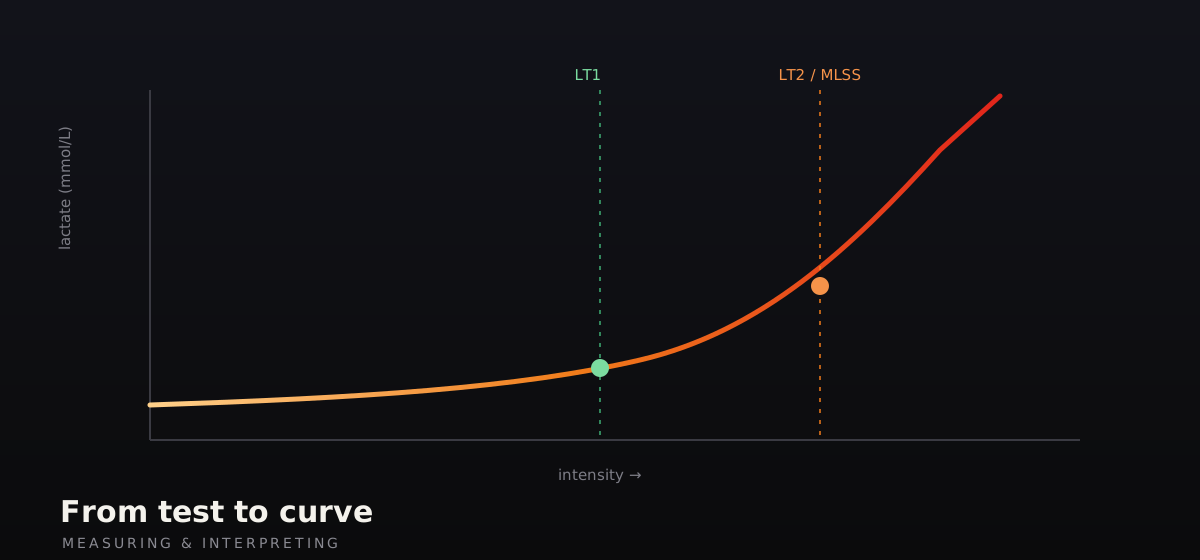
In Part I we saw that lactate is produced and why it is a balance of production and removal. Part II begins with the question every coach asks first: where is the threshold? The honest answer is that there is not one threshold, but a framework with two transitions and a long list of methods to estimate them.
Anyone who has a lactate test carried out receives a number in return: "your threshold is at 15.6 km/h" or "your anaerobic threshold is 172 beats per minute". That number looks hard and objective, but it conceals a choice. Behind every threshold value sits a method, and different methods place the threshold at a slightly different spot on the same curve. Faude, Kindermann and Meyer (2009) catalogued no fewer than 25 different threshold concepts in their influential review and brought order to them. For the coach that is no academic footnote but a practical foundation: if you do not know which threshold you are looking at, you also do not know what you may do with the accompanying speed.
This chapter builds that foundation. We start with the two-transition model (LT1 and LT2) and with the question of what happens physiologically in the muscle as you raise the intensity — because without that mechanism the thresholds remain loose numbers. We then put the popular fixed values of 2 and 4 mmol/L into perspective, discuss the mathematical constructions with which you extract a threshold objectively from a curve, and end at the gold-standard criterion to which all those methods must answer: the maximal lactate steady state.
1.1Not one threshold, but two transitions
The most usable model for coaches is the aerobic–anaerobic transition with two turnpoints (Faude et al., 2009). They divide the intensity spectrum into three working zones, separated by two thresholds.
The first is LT1, the aerobic threshold. LT1 is not a sign of oxygen shortage and also not a fixed number. It is the lowest exertion level at which the net appearance of lactate in the blood just rises slightly above the resting value, while a low steady state is still possible: production and clearance still keep pace (Ra ≈ Rd). Precisely that makes LT1 the lower boundary of the transition. Below it the exertion is so low that production and removal remain amply in balance and the blood lactate barely deviates from rest; the athlete can keep going for a very long time. This is the domain of the easy endurance run. The classic attempt to capture LT1 with a little number — "0.2 mmol/L above baseline" or "the first rise of about 1 mmol/L" — is no more than a detection trick for the test, not a definition of what is happening. The essence is physiological, not numerical: LT1 is the point at which the muscle first begins to structurally secrete more lactate than at rest, and the body can still fully clear that extra amount.
What makes the muscle begin to produce more lactate at that point? The key lies in muscle-fibre recruitment. As the running speed is raised the ATP demand rises, and the nervous system meets that demand by switching in ever more motor units in a fixed order. That order is Henneman's size principle (Henneman, Somjen & Carpenter, 1965): from small to large, from low-threshold to high-threshold. At low intensity almost exclusively the small, low-threshold motor units run, with their type I fibres (oxidative, MCT1-rich, excellent lactate oxidation). As the speed rises, higher-threshold motor units are progressively added on top, with more type II and glycolytic fibres. Precisely that gradual switching-in is the engine behind the lactate curve: the same progressive recruitment that drives the "slow component" of oxygen uptake (Vanhatalo, Poole, DiMenna, Bailey & Jones, 2011).
Newly recruited glycolytic fibres behave differently metabolically. They have a higher glycolytic flux, an MCT4-dominated lactate export and the M-rich LDH isoform (LDH-5), which pushes the equilibrium towards lactate formation. Per recruited unit, therefore, more lactate is added (Gladden, 2004; Dubouchaud et al., 2000). That first raises the intramuscular lactate and mildly disturbs intramuscular homeostasis — H⁺, inorganic phosphate (Pi) and the redox state (NADH/NAD⁺) shift. It is precisely that mild disturbance that is the driver: it drives export via MCT4 and sets the cell-to-cell lactate shuttle in motion. Lactate leaves the glycolytic fibres and is taken up by neighbouring oxidative fibres, by the heart, and by the liver (Cori cycle), where it is oxidised or reused (Brooks et al., 2021; Gladden, 2004).
At LT1 that systemic clearance still keeps pace with the increased production. The blood lactate therefore rises only slightly and can reach a low steady state. Above LT1 recruitment and glycolytic flux gradually begin to outrun clearance: ever more and ever more glycolytic fibres are added, while the uptake capacity of the oxidative tissues approaches its ceiling. The net lactate creeps upwards until the point at which a higher steady state is no longer attainable — the second threshold.
That second is LT2, the anaerobic threshold or the MLSS equivalent: the highest intensity at which lactate production and removal just remain in balance. Above it, production structurally exceeds removal, lactate accumulates and the exertion becomes by definition limited in time. LT2 is the most important boundary for the endurance runner: it separates what is sustainable from what is unsustainable. Note that "anaerobic threshold" is a historical name, not a mechanism: above LT2 there is no oxygen shortage in the muscle — recruitment simply runs ahead of clearance (Poole, Rossiter, Brooks & Gladden, 2021).
Between LT1 and LT2 lies a transition zone, not a sharp line. This is precisely why Part I insists so much on the balance idea: the curve rises not because something suddenly flips, but because the balance between production (Ra) and removal (Rd) gradually shifts towards more net accumulation, driven by progressive recruitment. The two thresholds are landmarks in a continuum, not switches.
1.2What happens physiologically in the transition zone
Line up the mechanisms and the transition zone becomes intelligible as one coherent process instead of a series of loose thresholds. Below LT1 the body runs almost entirely on oxidative type I fibres; the little lactate that is released is cleared on the spot by neighbouring fibres, heart and liver. Blood lactate then simply stays close to rest — not because no lactate is being made, but because production and clearance keep each other in balance (the balance of Part I).
Raise the intensity and the nervous system switches in ever higher-threshold motor units according to the size principle. Each new layer of fibres is slightly more glycolytic than the last: more MCT4, more LDH-5, a higher glycolytic flux. The lactate they secrete is initially still absorbed by the oxidative capacity of the rest of the body — this is the LT1 zone, where a low steady state is still possible. As you climb further, production per step grows faster than clearance can follow: the oxidative fibres, the heart and the liver approach their uptake ceiling, while precisely more glycolytic fibres are added per speed increment. The lactate concentration rises visibly, but as long as you still reach a (higher) steady state at a constant speed, you remain below LT2.
At LT2/MLSS this balance is exhausted: it is the last intensity at which clearance still exactly keeps pace with production. One step higher and production structurally wins — lactate accumulates without limit, intramuscular homeostasis (H⁺, Pi, redox) is disturbed more strongly, and the exertion becomes limited in time. The whole transition zone is therefore not an on/off switch but a progressive shift in the balance, driven by recruitment on the production side and by the finite oxidative capacity on the clearance side. Whoever holds on to that picture immediately understands why the same curve runs differently in different athletes (§1.3) and why one fixed number seldom fits.
1.3Fixed values: 2 and 4 mmol/L
The best-known threshold is the 4 mmol/L value, also called OBLA (onset of blood lactate accumulation). It stems from the Cologne school of Mader and Heck and became popular for one simple reason: one fixed number is easy to communicate. "Train below your 4 mmol speed" is a message every athlete understands. The 2 mmol/L value is often used as a rough approximation of LT1.
The problem is that those numbers pretend physiology adheres to a fixed boundary, and it does not. Faude et al. (2009) were pointed: fixed-value thresholds are handy, but not universally valid. The actual lactate value at the real steady state varies strongly between individuals — depending on sport, protocol and person. In one athlete the maximal steady state falls below 3 mmol/L, in another well above it. A fixed 4 mmol then places the threshold too high in one and too low in the other, with wrong zones as a result.
The mechanisms of §1.1 explain exactly why that is so. The height of the curve is a balance of production and clearance, and both sides differ strongly per athlete. An athlete with many type II fibres and a high glycolytic power (a high ċLaMax) pushes more lactate into the blood at the same speed; an athlete with a dense mitochondrial reticulum and much MCT1 in their oxidative fibres clears that same lactate faster (San-Millán & Brooks, 2018; Messonnier et al., 2013). Two runners with an identical MLSS capacity can therefore show a completely different lactate value at exactly that MLSS point. A fixed number ignores that: it lays one horizontal line over curves that run very differently because of different fibre profiles, different ċLaMax and different clearance capacity. Hence the real steady state falls below 3 mmol/L in one athlete and far above it in another.
That does not make fixed thresholds worthless. They are a rough first approximation and a fine means of communication, as long as you do not sell them as individual truth. For a group session, a first estimate or a conversation with a beginning athlete, "around 4 mmol" suffices perfectly well. But as soon as you build an individual plan, the shape and shift of the whole curve is more informative than one absolute cut-off point.
1.4Reading the curve objectively: Dmax, log–log and baseline+
To extract a threshold from a curve not by the naked eye but objectively, one uses mathematical constructions. Four of these are the ones coaches most often encounter.
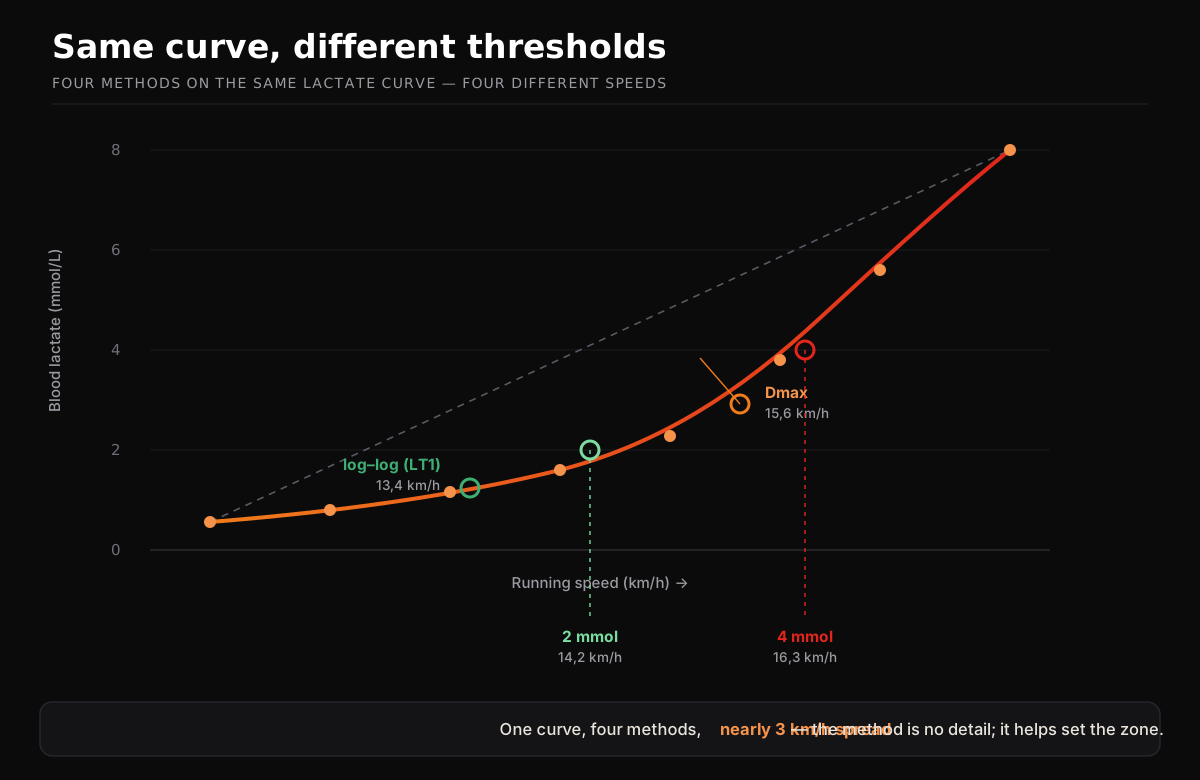
Dmax. Draw a straight line between the first and the last point of the lactate curve. The threshold is then the curve point with the greatest perpendicular distance from that line — the point where the curve "bends away" most strongly from the straight line. Dmax is attractive because it works fully automatically, but it is sensitive to the number of stages and the spread of the test: an extra-high final stage can tilt the line and shift the threshold.
Modified Dmax. The same construction, but the straight line now runs from the first point after the first clear lactate rise (for example +0.4 mmol/L above baseline) to the last point. By leaving the flat opening phase out of the line, modified Dmax partly corrects for the sensitivity of the ordinary Dmax and usually places the threshold somewhat more reliably.
Log–log. Plot the logarithm of the lactate against the logarithm of the intensity. In that log–log plane the curve becomes roughly two straight line segments, and their intersection marks LT1. The advantage is robustness against noise at low lactate values, precisely where the naked eye has the hardest time.
Baseline + fixed delta. Define the threshold as the point where the lactate rises a fixed amount above the baseline — for example +1 mmol/L or +1.5 mmol/L. This is an individual variant of the fixed-value method: not "4 mmol absolute", but "1.5 mmol above your own rest". It is intuitive and respects the individual starting point.
The core is that every method places the threshold at a slightly different spot on the same curve. That is not a fault in the methods, but a property of the curve: it bends gradually, and each method chooses a slightly different definition of "here it starts to get serious". Figure 1.1 makes that visible.
1.5Critique of fixed thresholds: 25 concepts, 3 categories
The great merit of Faude et al. (2009) is that they ordered the conceptual chaos. From the 25 threshold concepts found they distilled three categories, and that classification is still the clear peg for coaches.
- Fixed lactate values — the 2- and 4-mmol family: one absolute threshold value for everyone.
- First-rise concepts (LT1 family) — the point where lactate first clearly rises above the baseline.
- MLSS or knee concepts (LT2/IAT family) — the point of the sharp knee or slope change, which approximates the maximal steady state (including Stegmann, Keul, Simon, Berg, Dickhuth).
The message that follows from their analysis is that a threshold is not "true" or "false", but more or less valid for a particular purpose. A concept is valid to the extent that it (a) correlates strongly linearly with actual performance and (b) lies close to the real steady state. Fixed values score variably on that — sometimes well, often mediocre, and seldom for every athlete. For the coach this means: use the category that fits your question, and be explicit about which one you are using.
1.6MLSS: the gold-standard criterion
All those methods are estimators. What are they estimating? The MLSS, the maximal lactate steady state — the highest constant intensity at which the blood lactate remains stable over about 30 minutes. The common convention, attributed in Faude et al. (2009) to Beneke, is that the lactate may rise by no more than 1.0 mmol/L between minute 10 and minute 30 of a constant load.
MLSS is the gold-standard criterion because it directly captures the physiological meaning of Part I: precisely at the MLSS, lactate production (Ra) and removal (Rd) are still in balance (Billat, Sirvent, Py, Koralsztein & Mercier, 2003). It is the hinge intensity between sustainable and unsustainable. Billat et al. (2003) aptly describe MLSS as a bridge between biochemistry, physiology and sport science: it translates the invisible balance of Part I into a measurable speed. It is also the reason that the MLSS counts as the physiological reference point and not a fixed lactate value: the MLSS is defined by the balance between recruitment and clearance, not by the absolute height that the lactate happens to reach at that moment. Two athletes may have their MLSS at a different lactate value, but for both the same holds: it is the highest intensity at which Ra and Rd are still just in balance (Poole, Rossiter, Brooks & Gladden, 2021).
The downside is practical: a real MLSS determination requires multiple constant-load tests on separate days, each 30 minutes long. That is expensive, time-consuming and hard on the athlete. That is why in practice one almost always uses one incremental test with a threshold estimator (Dmax, log–log or a fixed value) as a proxy for the MLSS — in the knowledge that it remains an estimate. Whoever knows that does not sell the outcome as an absolute truth, but as a well-founded approximation that calls for verification and trend confirmation.
This brings us back to the balance model. A threshold is not a physical boundary in the muscle, but the point at which the balance between production and removal tips. In Chapter 2 we read the whole curve as the visible imprint of that balance; in Chapter 3 we place lactate alongside other measurement windows in order to read that imprint more reliably.
1.7Above LT2: critical speed and the maximal metabolic steady state
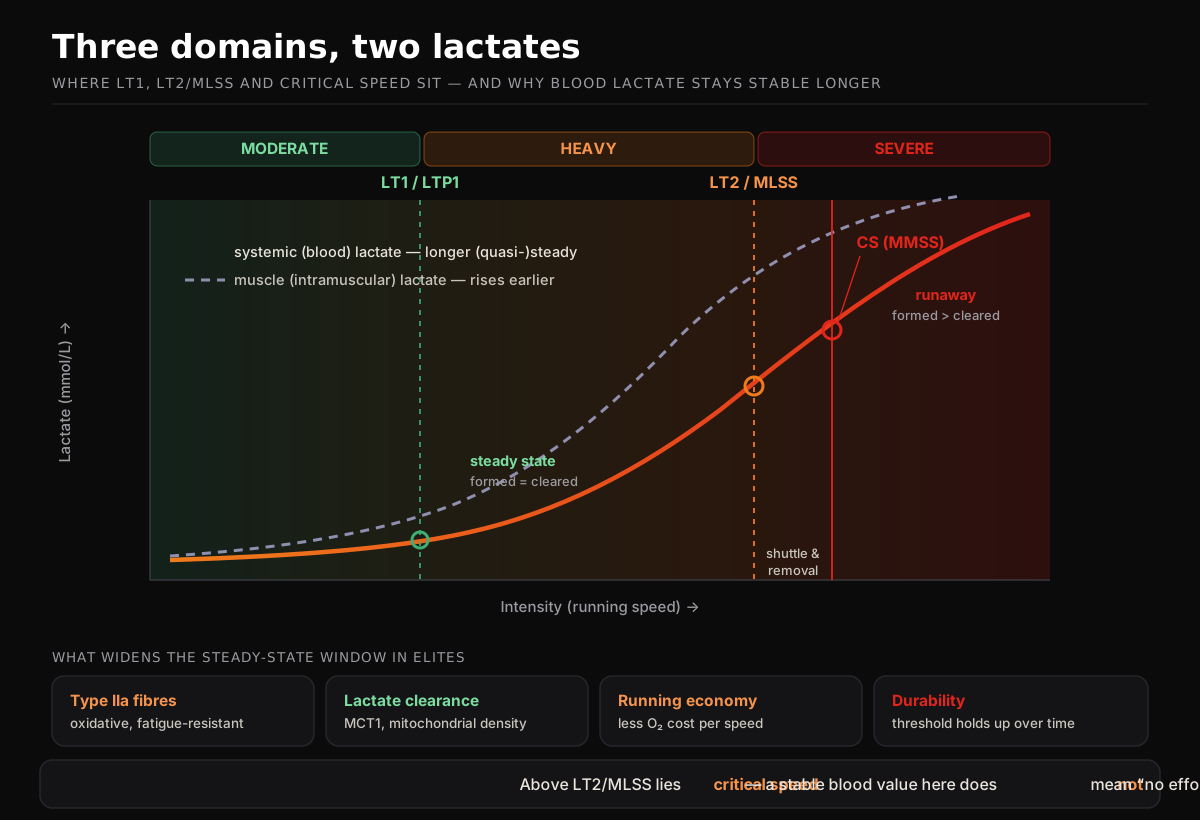
LT2/MLSS is not the upper boundary of the intensity spectrum, but a hinge within a broader domain framework. That same spectrum is divided in the critical-power/-speed literature into three intensity domains: moderate, heavy and severe (Jones, Burnley, Vanhatalo & Poole, 2019). LT1 marks the transition from moderate to heavy; the upper boundary of the sustainable zone — the boundary between heavy and severe — is marked by critical speed (CS), the running equivalent of critical power. CS demarcates the maximal metabolic steady state (MMSS): the highest intensity at which oxygen uptake and blood lactate can still settle at a — if necessary elevated — constant level. Above it, in the severe domain, no steady state exists any longer: VO₂ creeps up to VO₂max and lactate accumulates without limit until exhaustion (Jones et al., 2019).
Where does CS lie relative to LT2/MLSS? Both lie close together, at the upper end of the sustainable zone, but they do not coincide exactly. The conventional MLSS determination (30-minute loads; §1.6) usually places the boundary somewhat lower than CS, because an MLSS load must by definition be sustained longer than the ~20–30 minutes that exertion at CS allows. Jones et al. (2019) therefore argue that the classic MLSS slightly underestimates the real maximal metabolic steady state and that CS forms the purer boundary between sustainable and unsustainable. For the coach the nuance is therefore not "which number is correct", but: the upper boundary of the sustainable zone is a narrow band, in which MLSS lies at the lower end and CS at or just above the upper end — both mark the same physiological transition from heavy to severe.
It is precisely in that band that something happens which often confuses coaches: in very well-trained athletes, speed, oxygen uptake and running economy remain relatively stable for a long time, while the blood lactate nonetheless rises. That is no contradiction, but the logical consequence of the mechanisms of §1.1–1.2. First, their working muscle mass consists of exceptionally oxidative, fatigue-resistant type IIa fibres: these deliver high force without the strongly glycolytic signature of type IIx, and critical power correlates positively with the proportion of oxidative fibres and capillarisation (Mitchell, Martin, Bailey & Ferguson, 2018). Second, elites possess an outstanding lactate clearance — much MCT1, a dense mitochondrial reticulum — so that the lactate the glycolytic fibres secrete is quickly taken up by neighbouring oxidative fibres, heart and liver (the cell-to-cell shuttle of Part I; Dubouchaud et al., 2000; Brooks et al., 2021). Third, their strong running economy shifts the entire speed–lactate relationship to the right: less oxygen and substrate cost per metre run means less glycolytic pressure at the same speed.
Hofmann and Tschakert (2017) describe exactly that with the distinction between muscular (intramuscular) lactate and systemic (blood) lactate. In their three-phase model it holds that: below LTP1 (≈ LT1) the muscle is metabolically in balance and the system stays at rest level; between LTP1 and LTP2 (≈ LT2) muscular production exceeds muscular clearance, but the surplus is "shuttled" to the system and there cleared by resting muscles, heart and brain, so that a systemic steady state settles at an elevated level. Only when the maximal systemic clearance is also exceeded — at LTP2/CS — does lactate accumulate without limit. The consequence: as intensity rises, the intramuscular lactate rises earlier and more steeply than the blood lactate, which, through the shuttle and clearance, holds on to a (quasi-)steady state for longer. In elites, with their superior clearance, that difference is greatest: their blood value can climb steadily while the pace remains unaffected. Figure 1.2 summarises this.
A fourth characteristic plays out only over time: durability, the resistance to the leftward and downward shift of thresholds as an exertion lasts longer. In eighteen marathon runners, after a pre-load of 90 minutes at threshold pace, the speed at the lactate threshold fell from an average of 12.8 to 12.1 km/h and the VO₂peak from 56.7 to 53.4 mL·kg⁻¹·min⁻¹, while running economy and fractional utilisation remained unchanged; crucially, the percentage decline of the threshold speed correlated with marathon performance (r = 0.68): whoever held their threshold better ran faster (Hunter & Muniz-Pumares, 2025). And it is not merely the duration that counts — the intensity of the preceding work determines how strongly the power–duration relationship drops (Spragg, Leo, Giorgi, Martinez Gonzalez & Swart, 2024). Elites shift more slowly and less: their fresh threshold therefore tells only part of the story.
The coaching translation is direct. A stable blood value does not mean "no exertion": in the band around CS the athlete can be metabolically heavily loaded while the blood lactate still holds a quasi-plateau through the shuttle and clearance. Conversely, rising lactate in an elite does not automatically mean that the pace collapses: thanks to type IIa oxidation, clearance and economy, speed and running economy can be maintained while the blood value rises. For threshold determination it follows from this that you may not hang the upper boundary on one lactate number, but on its sustainability — preferably verified with a constant-load or durability test (§1.6, and further in Part II). And for zone classification: the severe domain above CS is a separate training zone with its own logic (VO₂max work, time-to-exhaustion), not simply "a touch harder than threshold".
A threshold number is never "the truth" — it is a choice of method. Be explicit about which threshold you mean, and use the curve itself, not one cut-off point, to build zones.
- "Your threshold is 4 mmol, full stop."
- "The anaerobic threshold is a fixed line."
- "This number is objective, so correct."
- "Every athlete flips over at the same value."
- "With this method your threshold lies here."
- "There are two transitions, LT1 and LT2."
- "The number depends on the chosen method."
- "Your own steady state lies where production and removal are still in balance."
Key sentence: we do not determine a magic number, but estimate where your balance between production and removal tips — and we refine that estimate with the curve and with repetition.
- Billat, V. L., Sirvent, P., Py, G., Koralsztein, J.-P., & Mercier, J. (2003). The concept of maximal lactate steady state: A bridge between biochemistry, physiology and sport science. Sports Medicine, 33(6), 407–426.
- Brooks, G. A., Arevalo, J. A., Osmond, A. D., Leija, R. G., Curl, C. C., & Tovar, A. P. (2021). Lactate in contemporary biology: A phoenix risen. The Journal of Physiology, 600(5), 1229–1251.
- Dubouchaud, H., Butterfield, G. E., Wolfel, E. E., Bergman, B. C., & Brooks, G. A. (2000). Endurance training, expression, and physiology of LDH, MCT1, and MCT4 in human skeletal muscle. American Journal of Physiology-Endocrinology and Metabolism, 278(4), E571–E579.
- Faude, O., Kindermann, W., & Meyer, T. (2009). Lactate threshold concepts: How valid are they? Sports Medicine, 39(6), 469–490.
- Gladden, L. B. (2004). Lactate metabolism: A new paradigm for the third millennium. The Journal of Physiology, 558(1), 5–30.
- Henneman, E., Somjen, G., & Carpenter, D. O. (1965). Functional significance of cell size in spinal motoneurons. Journal of Neurophysiology, 28(3), 560–580.
- Hofmann, P., & Tschakert, G. (2017). Intensity- and duration-based options to regulate endurance training. Frontiers in Physiology, 8, 337.
- Hunter, B., & Muniz-Pumares, D. (2025). Durability of parameters associated with endurance running in marathoners. European Journal of Sport Science. Advance online publication.
- Jones, A. M., Burnley, M., Vanhatalo, A., & Poole, D. C. (2019). The maximal metabolic steady state: Redefining the "gold standard". Physiological Reports, 7(10), e14098.
- Mitchell, E. A., Martin, N. R. W., Bailey, S. J., & Ferguson, R. A. (2018). Critical power is positively related to skeletal muscle capillarity and type I muscle fibers in endurance-trained individuals. Journal of Applied Physiology, 125(3), 737–745.
- Messonnier, L. A., Emhoff, C.-A. W., Fattor, J. A., Horning, M. A., Carlson, T. J., & Brooks, G. A. (2013). Lactate kinetics at the lactate threshold in trained and untrained men. Journal of Applied Physiology, 114(11), 1593–1602.
- Poole, D. C., Rossiter, H. B., Brooks, G. A., & Gladden, L. B. (2021). The anaerobic threshold: 50+ years of controversy. The Journal of Physiology, 599(3), 737–767.
- San-Millán, I., & Brooks, G. A. (2018). Assessment of metabolic flexibility by means of measuring blood lactate, fat, and carbohydrate oxidation responses to exercise in professional endurance athletes and less-fit individuals. Sports Medicine, 48(2), 467–479.
- Spragg, J., Leo, P., Giorgi, A., Martinez Gonzalez, B., & Swart, J. (2024). The intensity rather than the quantity of prior work determines the subsequent downward shift in the power–duration relationship in professional cyclists. European Journal of Sport Science, 24(9), 1287–1296.
- Vanhatalo, A., Poole, D. C., DiMenna, F. J., Bailey, S. J., & Jones, A. M. (2011). Muscle fiber recruitment and the slow component of O₂ uptake: Constant work rate vs. all-out sprint exercise. American Journal of Physiology-Regulatory, Integrative and Comparative Physiology, 300(3), R700–R707.
- Wackerhage, H., Gehlert, S., Schulz, H., Weber, S., Ring-Dimitriou, S., & Heine, O. (2022). Lactate thresholds and the simulation of human energy metabolism: Contributions of the Cologne Sports Medicine group. Frontiers in Physiology, 13, 899670.
This is chapter 1 of eight. The complete Lactate Guide — Part II runs to 104 pages with 13 scientific infographics and is supported with 58 sources and references (with DOIs where available); every chapter is translated into training practice.
You will find the complete guide in the store.
The Lactate Guide · Part II · free preview